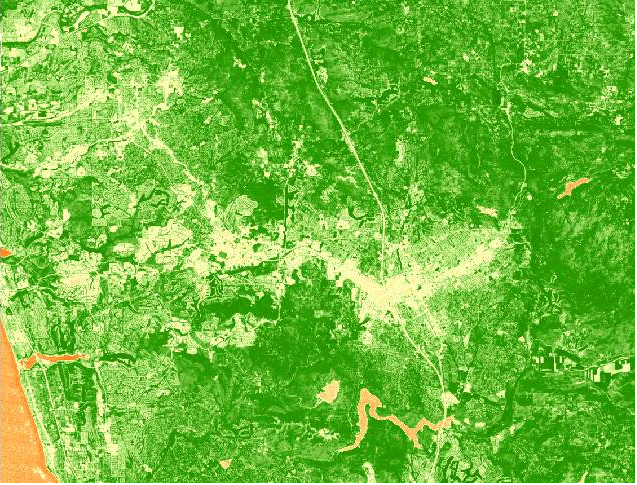
To get April NDVI, do the following (you already did these steps before, but click the links for an animated gif to show you how if you don't remember):
1. Add the image composite_april_2011.img from the folder Activity3.
2. Calculate NDVI for that layer.
The NDVI map should look like this.

As we expected, it certainly looks greener in April than in November. But, if you look closely you'll see that some areas look the same, and some look different between the seasons. There are even a few areas that seem to have higher NDVI in November than in April.
In the next step we'll make a composite image of these NDVI layers so we can see how they compare across the entire map.