Life tables are used to track the history of a cohort of individuals that are marked at birth until every individual in the cohort dies. Life tables assume known fates, meaning that we know each year whether each individual has lived or died, which in most instances requires geographic closure and perfect detectability (that is, we assume the probability of encounter is 1). For any species that lives longer than a few years life tables are extremely difficult to construct, and are thus relatively rare. More commonly, estimates for survival and reproduction are made for individuals of various known ages or age classes (such as juveniles and adults) over a period of a few years, and these age-specific values can then be used to estimate a life table for the species. This is the kind of life table we will be working with today, which was constructed using survival and reproductive rates for ravens in the Mojave study that we used last week to estimate reproduction.
The life table I put together for you is for a hypothetical population of 1000 female ravens (download it and open it in Excel). Life tables are often constructed just for females, because males just don't matter (well, not that they don't matter at all, but since females do the egg laying they are more important for the population growth rate than males are).
The spreadsheet has only three columns at this point:
If you select a cell other than B2 in the nx column you'll see it's actually a formula, multiplying the number in the previous cell by a survival rate to get the expected number of individuals that year. The survival rates are in cells B20, B21, and B22, and which one is used depends on the age of the birds. The survival rate currently entered in B20 is 0.35 for the first year, in B21 is 0.8 for the second year, and in B22 is 0.8 for adults. These are set up as formulas to make it easier for us to try out different values to see how population growth rate changes.
Similarly, once ravens reach breeding age the mx column shows a value of 1.027 for offspring per female, but you'll see that all of the non-zero entries are pointing to either B23, B24, or B25 depending on the age of the birds. The values in those three cells are all set to the same number of 1.027 at the moment, but we will be able to change the reproductive rate for young breeders (age 3 and 4), experienced breeders (ages 5 through 13), and old breeders (ages 14 and 15) to see how age-specific changes in reproduction would affect growth rate. The cells are color coded so you can easily see which of the cells in the nx and mx columns are being calculated by the rates in B2 through B26.
Now to analyze the life table:
1. Calculate survivorship (lx). Survivorship is the proportion of the original cohort still alive at age x. This is different than the annual survival rate, and it declines each year as an increasing number of the original 1000 birds dies.
You'll see that you now have proportions of the original population that are alive at each age - since each number is being divided by 1000, check that your lx numbers are the nx values divided by 1000.
2. Calculate lxmx. In E1 type "lxmx", and in E2 type =c2*d2. Copy and paste this to the rest of the ages. This column weights the reproduction values from column C by the proportion of the population still alive at that age.
3. Calculate net reproduction, R0. In cell D22 type "R0", and in E22 sum the lxmx column. This is the net reproductive rate, and if it's over 1 the population is increasing (you should get a value of 1.0814).
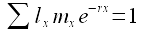
4. Set up the Euler equation. We will use the Euler equation to estimate growth rate, r, in the next step. The Euler equation is:
We already have lxmx in column E, so we just need to multiply the lxmx values in E by e-rx, and then sum the values.
We already know that our initial guess for r of 0 is wrong, because R0 is over 1. But, that's okay - the value of 0 is just the starting point we need for Solver to work with.
5. Estimate r from the Euler equation. Fire up Solver, and have it set the Euler sum in F20 to a value of 1 by changing the value of r in cell E23. You should get a value of 0.012688 - which means the population is...what? Stable, increasing, or decreasing? Click here to see if you're right
6. Calculate generation time. Generation time tells us how how much time there is separating generations - that is, how old the ravens are on average when they reproduce.
To get generation time we need to multiply the lxmx column by the age column - in cell G1 type "xlxmx", and in G2 enter =a2*e2. Copy and paste to the rest of the ages.
Now, in cell D24 enter "G" (for generation time), and in cell E24 enter the formula =sum(g2:g18)/e22 - this divides the sum of the xlxmx column by the net reproductive rate in E22. This value of 6.2289 tells you that on overage ravens are 6.2298 years older than their offspring.
7. Calculate lambda. The discrete version of r, which is equal to next year's population size divided by this year's, is called λ, and is equal to the er. In cell D25 write "Lambda", and in E25 enter =exp(e23). The population is increasing 1.2769% each year.
8. Record the results of the initial model. Now to record the estimated lambda for this first life table analysis.
In cell A28 enter the label "Lambdas". In A30 enter the label "Initial", and then copy the lambda value from cell E25 and paste-special the value to cell B30.
9. Make some changes to parameter values. Now we can try setting each of the parameters in B20 through B25 to 90% of their current values, one at a time, to see how this affects population growth. The basic process will be to change one of the parameters, run Solver to get a new estimate of r, and then record the lambda value in the Results list below.
11. Graph the results. The most important statistic for monitoring purposes is the population growth rate - we'll focus on lambda as our growth rate measure, as we will be using that when we do matrix models next time.
You can see that the demographic rate that has the biggest effect on growth rate is adult survival - a 10% reduction in adult survival drops lambda the most relative to the initial value of 1.01277. Changing adult survival is more important than changing survival of the younger ages, because the adults are doing most of the breeding.
Reproduction is less important in general, particularly for the older birds. Very few ravens live to 14 or 15 years old, so reducing their reproductive rate has almost no effect on population growth. Since the species is relatively long-lived, each individual usually has more than one opportunity to breed, and survival is low for the first year, so most of the offspring produced die before breeding. Long lived species often show a greater sensitivity to changes in adult survival than to change in juvenile survival, or reproduction in any age.
That's it! Save your spreadsheet for your report.