We are only going to spend one week on relational databases, but we could easily spend the entire semester on them. We will focus on what is probably the feature that is most likely to be of use to you, and that Excel does not support well: one to many relational joins. Unless you decide to learn more about MS Access on your own, outside of class, you will probably enter data in Excel, import it into Access, join your tables, then export the joined tables back into Excel. That is what we will do today.
1. Start MS Access and make a blank database. Before we do any importing of data from Excel, we'll make a blank database in which to put the data. Note that Access is not available for the Mac, so if you're using your own Mac you'll need to use Citrix for today.
Start Access 365 and you will see a fairly cluttered startup screen that looks like
this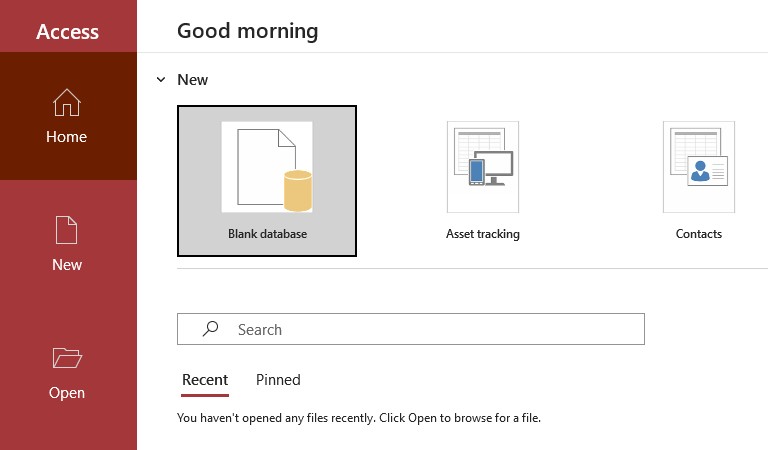 . We are going to ignore
much of the clutter, but most of it is providing easy access to templates for a variety of common business
databases (Access is marketed heavily towards business users).
All we need is to click the "Blank database" button, which will bring up a "Blank database" creation window. Click on the "open folder" icon next to the file name field, and then navigate to the location on OneDrive, name the database "mice" and click "OK".
Then, back in the "Blank database" window click "Create" to make the new, empty database. You will now see the
Access interface with a new, blank table called Table1 (it will look like this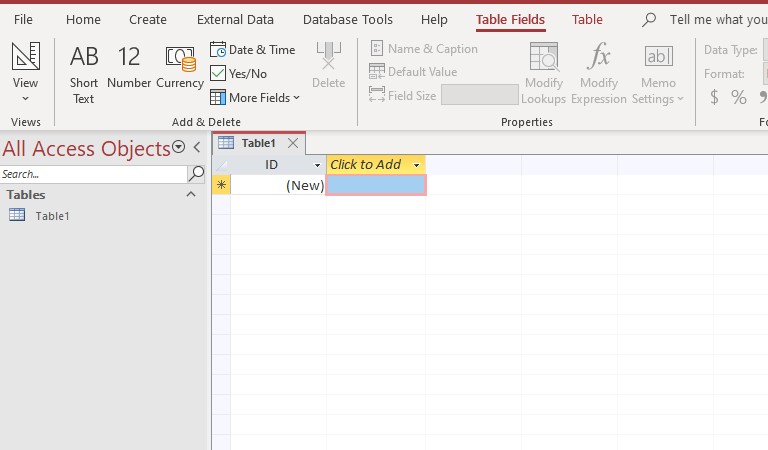 ). We'll import the data from an Excel file, which
we'll go download now.
2. Download the data. Download this spreadsheet (mice.xlsx), and save it to your OneDrive (it's convenient to put it in the same place as your mice.accdb that you just created). Once you have it downloaded open mice.xlsx in Excel to see how the data are organized.
- The data represent an experiment in which ten different mice were assigned different diets, and their body weights were measured daily for a period of 10 days. There are two worksheets with data in them:
- Mouse - this sheet records several characteristics of each mouse, such as age, sex, and the diet they were fed on.
- Weights - the daily weights measured for each mouse, once for each of the 10 days of the study.
Since there will only ever be one row in the Mouse table for each mouse, but there will be 10 rows for each mouse in the Weights table, there is a one to many relationship between the Mouse and the Weights table.
Be sure to close Excel before you proceed - Access won't open this file while Excel has it open.
3. Import the first worksheet, Mouse, into Access. To import the data we'll use the "External Data" import tools.
- Click on the "External Data" tab, and then click on "New Data Source" → "From File" → "Excel
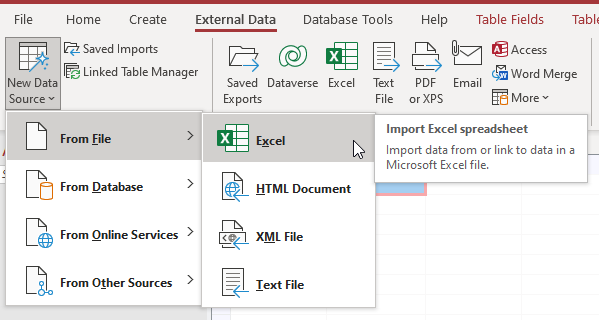 ".
". - Browse to the "mice.xlsx" Excel spreadsheet you downloaded and select it. You will be importing the data into a new table, which is the default option, so click "OK"
- The "Import Spreadsheet Wizard" that pops up will lead you through the process of importing the data. You will only be able to do one sheet at a time, so start with "Mouse" - click "Next".
- The next step asks whether the first row of the sheet contains the column headings. These will be used as the field names in Access - the sheet does include names for the columns, so click "Next".
- The next step allows you to set the data type for each of the columns. It will make a guess based on the contents of the file, but you may not like the choices made and you need to check. Use the variable types:
- Mouse ID is numeric, but it only contains numbers up to 10 with no decimals, so change the Data Type from "Double" to "Integer" ("single" and "double" are both floating-point data types used for decimal numbers; double can record more significant digits than single).
- Ages are all integer numbers, so change the type to "Integer" (ages are in months, and none are greater than 255).
- The last two columns are short text, which you can confirm Access guessed correctly.
- Once you have the variable types assigned correctly click "Next"
- The next screen allows you to create a "primary key" for the table. A primary key is a unique identifier for every record in the data table, and relational databases need to have a unique identifier for every record (that is, every row in a table). Access will allow you to create a new variable to use as a primary key, and populate it with sequential numbers for you, but if you have a unique identifier in your data set already you can use that instead. Since the mouse table will only ever have a single record for each mouse we can use Mouse ID as the primary key - click on "Choose my own primary key" and select "Mouse ID"; using Mouse ID as a primary key will cause Access to help us make sure we don't accidentally use the same ID for more than one mouse. Click "Next".
- Finally, you are given the chance to change the name of the table if you choose - "Mouse" is fine, so don't change anything. Click "Finish".
- If you are prompted to save the import steps you don't need to - this is only useful if you repeatedly import data with the same organization, such as updating a database with new data each day.
With the import completed you will see a new table called "Mouse" in the list on the left of the screen, and if
you double-click it the table will open and show you the data (it should look like this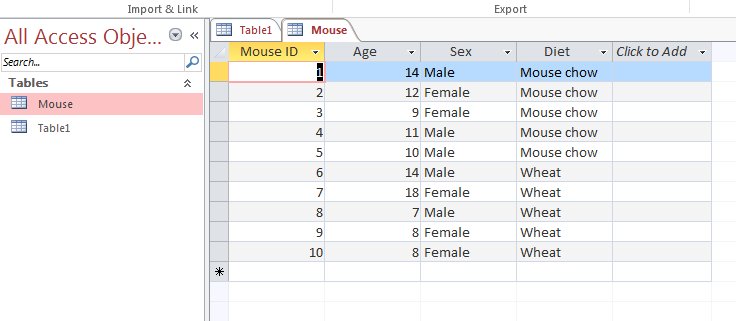 ).
).
4. Import the Weights sheet from the Excel file. Repeat the import steps you just completed, but this time import sheet Weights. When you are asked to define the data types for the fields use:
- Mouse ID = integer
- Measurement Day = integer
- Weight = double (double refers to double-precision floating point numbers, which is a good choice for decimal data).
Allow Access to create a primary key for this table - since there are multiple records for weights of the same mice we can't use Mouse ID as a primary key for the weights table.
When you're done you'll see a second new table, Weights, in your list. Double-click it and you'll see
this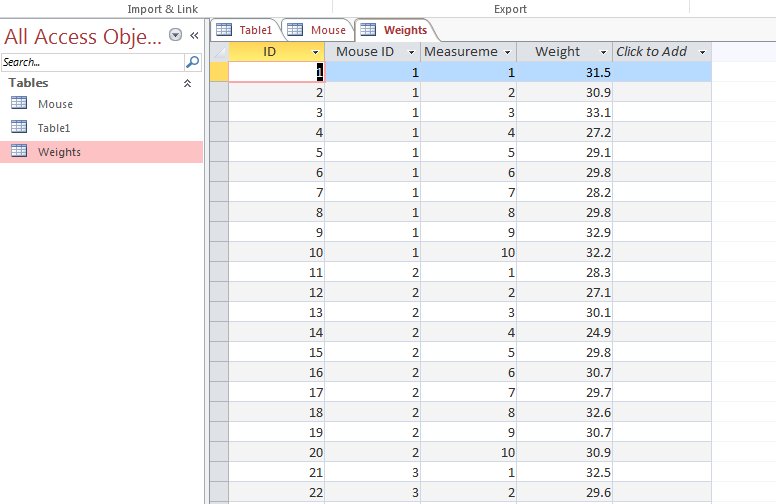 .
.
Relational joins and queries
5. Joining the tables using a query. Now we will join the Mouse and Weights data based on matching Mouse ID's. Joining is done in a query, which is a term that refers to all manner of operations that retrieve data from a database. Queries can be designed and then saved, so we use "query" both as a verb (to query the database is to retrieve data from it) and a noun (a query is a set of commands that retrieve the data). We will design a query (noun) in order to query the joined mouse and weights data (verb).
To open the query design view switch to the "Create" tab, and select the "Query Design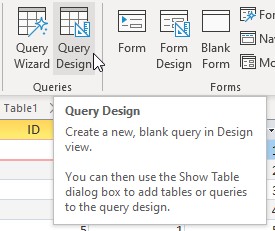 " option. In the query designer form that pops up do the
following:
- From the list of tables (Add Tables), select and add both the Mouse and Weights tables by dragging them into the gray box underneath the label Query1.
- Join the tables next - you'll see that since we have a field called "Mouse ID" in each table, Access guessed
(correctly) that this is the column that's common between the tables, and should be the basis for joining them
together. You can see this as a black line that connects the two tables, like this
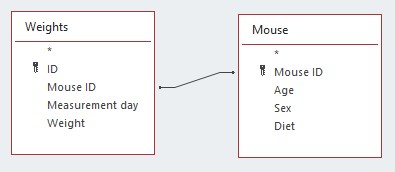 . It's nice when Access guesses the relationship correctly, but you need to
learn to do this yourself - so, click on the black line to select it, then hit the "delete" key to remove the
relationship. To make the connection yourself, click on the "Mouse ID" label in the "Mouse" table, drag it to
the "Weights" table, and then drop it on top of the "Mouse ID" label there - your link joining the two tables
should reappear as it was before.
 - Check the kind of join being used now - if you double-click on the black line, you'll see that there are different ways to make the link between tables. The difference between them has to do with which records will be displayed in the event that there are Mouse ID's in one that aren't found in the other. The choices are:
- Only include rows where the joined fields from both tables are equal - any Mouse IDs that don't appear in both tables are dropped from the results. This is the default, and the one you want to use, so keep it selected. FYI the other options are...
- Include ALL records from "Mouse" and only those records from "Weights" where the joined fields are equal - every Mouse record will appear even if it doesn't have any weights recorded, but weights will only be reported if they match a record in the Mouse table
- Include ALL records from "Weights" and only those records from "Mouse" where the joined fields are equal - all of the Weights will be reported even if they don't have a matching mouse ID, but mice will only be reported if they match a record in the Weights table
- Include all of the records from both tables - include all of the Mouse and all of the Weight records, even if they don't match between tables
- You can click on the "Cancel" button to close the Join Properties.
- Build the query now - double click on the following fields to add them to the query:
- Mouse table - Mouse ID, Age, Sex, and Diet (we'll only include Mouse ID once, and it doesn't matter which table it comes from since it's in both)
- Weight table - Measurement Day, and Weight
- Run the query now - click on "View
 " to
switch from design view (in which you build the query) to datasheet view (in which you see the result). You
should see a table with the weights for each day, but now with all the Mouse table fields repeated for each
day of weighing (like this
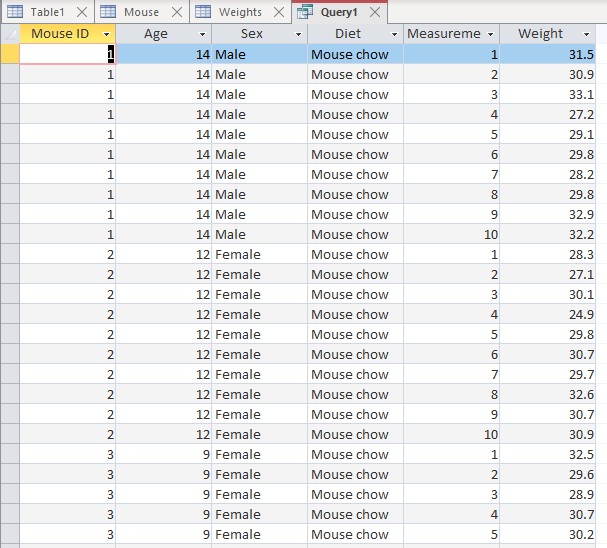 ).
). - Right-click on the query's tab and save it - call it "JoinedFiles"
Note that this query has all the ages, sexes, and diets repeated for each day of measurement, without having to actually enter this information multiple times.
Also, be aware that while the tables are permanently stored on disk, the query is a temporary, on-the-fly reporting of data from the tables. Queries can be saved and re-executed to re-create a view of the joined files, and queries can even be used as though they are tables in other queries. It's possible to use queries to combine data from tables for viewing, and only if the data need to be combined together permanently is it necessary to make a new table with the query output.
To use the query-joined data to do some analysis in another program, such as Excel, you will need to export the query. That's what you'll do next.
Moving the data from an Access query to an Excel spreadsheet
6. Copy and paste the query data to Excel. The simplest, quickest way to get the data back into Excel is to copy and paste it. To do this:
- Open the mouse.xlsx file in Excel
- Switch to Access and click on the box in the upper left corner of the Access query (here
 ) to select all the records.
 - Right-click and copy the joined data
- Switch to Excel and paste them in sheet 3, which is blank. Save the file.
Another way to get the data out of Access and into Excel is to export the query as an Excel file - we'll do that next, after learning to filter the data based on one of the query fields.
7. Filter the data based on sex, and then export to an Excel file. In addition to using queries to pick which fields we want to export we can also filter the data within a variable like we did in Excel. To do this:
- Go back to the Design view for your Joined files query
- Under the Sex query field enter Females as the "Criterion".
- Switch back to datasheet view and you'll see that you now only get the females reported by the query.
- Right-click the query's tab and save it again.
You can now export this version of the query by:
- Right-clicking on the name of the query in the All Access Objects list
- Select "Export" → "Excel"
- Name the file "females.xlsx" and save it to your OneDrive
- The rest of the settings are fine as their defaults - click "OK" to complete the export
If you open the file in Excel you'll see the female data in it.
Relational joins in Excel
Although the relational database management capabilities of Excel are much more limited than in Access, it is possible to establish relationships between tables based on matching columns, and then use the joined tables as though they are one in a PivotTable. Let's briefly see how this is done, using the mouse.xlsx file.
1. Open the mouse.xlsx file in Excel. Since we imported our data from mouse.xlsx into Access for joining, it is already in the right format to set up a join in Excel. In general, though, to join tables in Excel they have to be organized as stacked data - rows that indicate individual observations, columns that indicate variables.
2. Format the Mouse data as a table. To use data for relational joins we first have to format the data sets as tables, and give them names. To do this:
- Select a cell within the Mouse data, and click the "Format as Table"
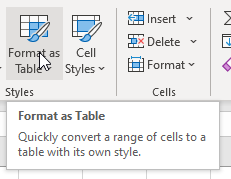 button in the Styles block of buttons in the Home tab.
 - First, you will see a drop-down list of possible formats - the appearance you pick won't affect the outcome, feel free to pick whichever one you find appealing.
- Next, the "Create Table" window will pop up, identifying the range of data that will be used for the table - it should found the contiguous rows and columns and lit them in the "Where is the data for your table?" field. Your table has column names, so leave the "My table has headers" box checked.
- Click "OK".
- Your data will now have filters enabled, and will have whatever formatting choices you made applied, such as shaded cell backgrounds, and border lines.
- A new tab of controls will also have been activated, the "Table Design" tab, which has a variety of tools we don't need at this point. On the left side, though, is the "Table Name", which will be set to "Table1" - change that to "mouse" and hit ENTER.
Now, do the same for the data in the Weights sheet - call the table you create "weight".
3. Establish the relationship between mouse and weight. Next we need to tell Excel how our tables are related:
- Switch to the "Data" tab, and click "Relationships"
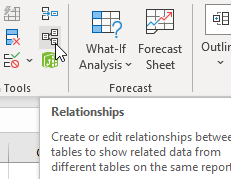 .
. - When the "Manage Relationships" window opens click on "New".
- Drop down the "Table" selector and pick "mouse", then set the "Column (Foreign)" to "Mouse ID".
- Then drop down the "Related Table" list and select "weight", with "Mouse ID" as the "Related Column (Primary)".
- Then click "OK", and "Close" the "Manage Relationships" window.
The relationship between the tables is now established, and we can use it to make a PivotTable that uses data from both of them.
4. Use the joined tables in a PivotTable. To use the joined data we will insert a PivotTable, but with one difference from our previous ones...
- Switch to the "Insert" tab, and drop down the PivotTable menu and select "From Data
Model"
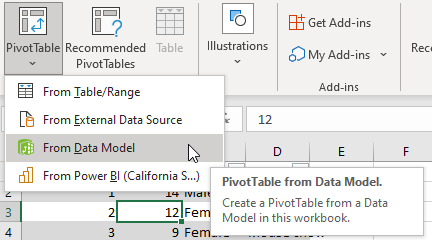 . Instead of using the data in cells
we've selected, the "From Data Model" option uses our joined tables from the previous step.
 - In the "PivotTable from Data Model" window accept the "New Worksheet" default choice by clicking "OK".
You will get a blank PivotTable with both of your tables listed in the PivotTable Fields. You can drag these into row, column, and sigma-values boxes as you like to make a PivotTable that uses the joined data. For example, if we want to calculate the average weights for male and female mice you can drag Sex from mouse into the rows, and Weight from weights into the Σ Values field, then change the value field settings to Average - this will use the sexes from one table for grouping, and the weights in the other table for the calculation.
There are some potential pitfalls, though, in using Excel for this - we can see the problem if we use the PivotTable to count up the number of measurement for each mouse. Let's make a new PivotTable to explore this:
- Select a cell outside of the current PivotTable, and Insert PivotTable from data model again.
- In this new PivotTable you can get a count of how many observations there are for each mouse by dragging Mouse ID from the weights table into rows, dragging it again into Σ Values, and then setting the value field setting to "Count" - you'll see there are 10 observations per mouse.
- Now, if you drag the Mouse ID from weight out of both boxes, and re-do the table using Mouse ID from mouse instead, you'll see you only get a 1 for each mouse.
Why are these two counts of sample sizes different? Because the PivotTable still treats the joined data as two separate tables, and counts how many rows there are with the same Mouse ID in whichever table you've used - one for Mouse, and ten for weights.
This would not happen in Access, because the joined data reported by the query is treated as a single table. When the query is run and Mouse ID is reported there are ten repetitions of each ID, regardless of whether Mouse ID came from the Mouse table or the Weights table.
The other thing to be aware of in using joins in Excel is that they are limited to joining two tables at a time, whereas any number of tables can be joined in Access. We only had two tables to join, but if we had additional ones we could have joined them as well as long as they had a matching column with one of the tables.
Assignment
When you're done, post a copy of your Access database file, the Excel files with your exported query data, and your mouse.xlsx file with the joined tables and PivotTable to the class web site.